
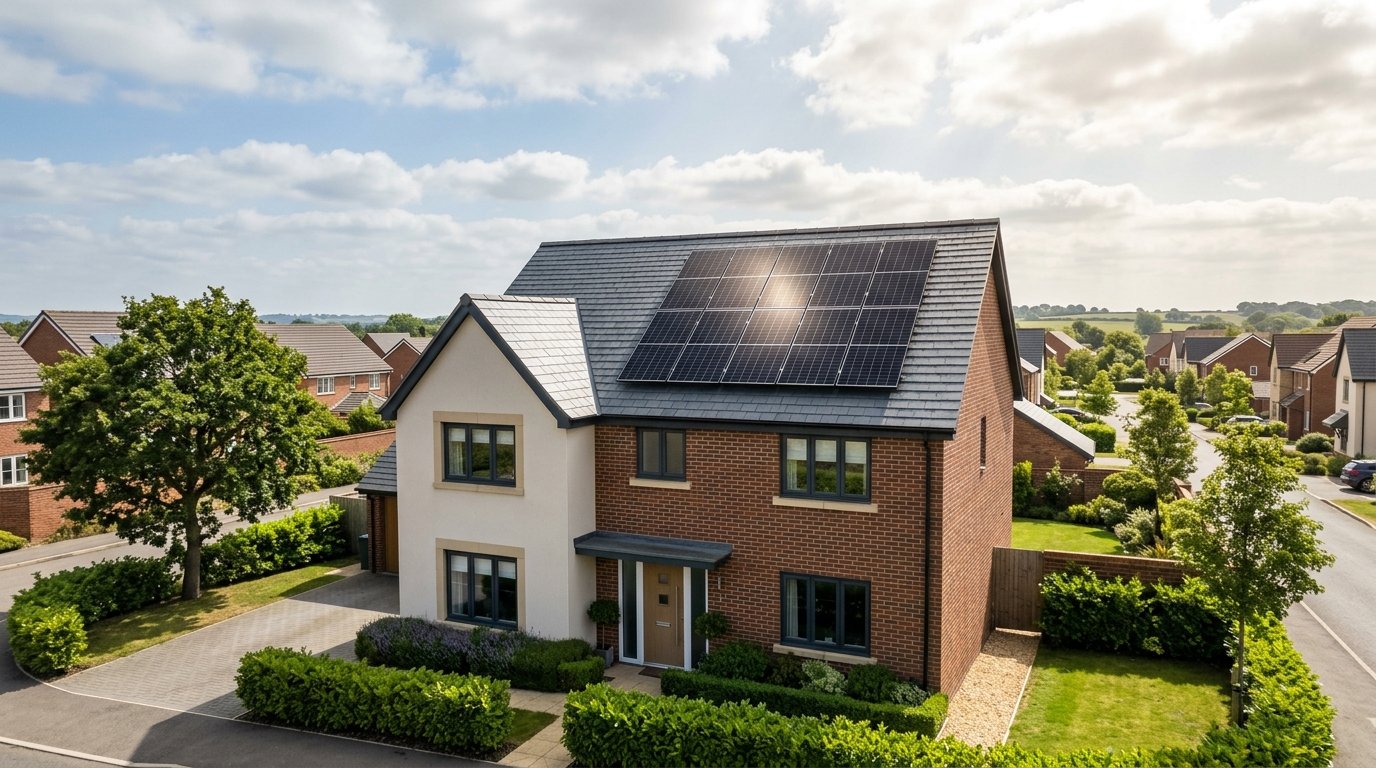
A 400W solar panel could generate roughly 320–400 kilowatt-hours (kWh) of electricity per year using the Centre for Alternative Technology’s broad UK benchmark of 800–1,000kWh annually per kilowatt of installed solar capacity. Divided across 365 days, that works out at approximately 0.9–1.1kWh per day. This is a starting estimate, not a prediction for every roof.
Actual output depends on where the panel is installed, which direction it faces, its angle, shading and the weather. The daily average also hides a substantial seasonal difference: generation is generally higher in summer and lower in winter.
To understand what a 400W panel could contribute to your home, it helps to separate its rated power from the electricity it produces over time.
What does the 400W rating actually mean?
The 400W figure describes a panel’s electrical power output under Standard Test Conditions, often shortened to STC.
These conditions include solar irradiance of 1,000 watts per square metre and a solar cell temperature of 25°C, alongside a defined sunlight spectrum. Manufacturers use these standardised conditions to give panels a comparable power rating. They do not describe the conditions on your roof throughout the day.
A useful distinction is:
| Measurement | What it tells you |
|---|---|
| Watts (W) | Electrical power at a particular moment. |
| Kilowatts (kW) | The same measurement expressed in thousands of watts. A 400W panel is rated at 0.4kW. |
| Kilowatt-hours (kWh) | The amount of electricity generated or used over a period of time. |
For example, if a panel maintained an output of 400W for one hour, it would generate:
0.4kW × 1 hour = 0.4kWh
If it averaged 200W over five hours, it would generate:
0.2kW × 5 hours = 1kWh
Both calculations are straightforward. The challenge is knowing the output the panel will actually maintain as sunlight changes.
This is why “400 watts per hour” is not the correct way to describe the rating. Watts already measure power; watt-hours or kilowatt-hours measure accumulated energy.
How much electricity does a 400 watt solar panel produce in the UK?
Using the broad UK benchmark above, the annual calculation is:
0.4kW × 800–1,000kWh per installed kW = 320–400kWh per year
The equivalent averages are:
| Period | Calculated electricity generation |
|---|---|
| Year | 320–400kWh |
| Month, averaged across the year | Approximately 27–33kWh |
| Day, averaged across the year | Approximately 0.9–1.1kWh |
These figures are calculated from a general benchmark. They are not measurements from a particular 400W panel or a location-specific simulation.
A monthly average of 30kWh does not mean you should expect 30kWh every month. Equally, annual generation outside this range does not automatically indicate a problem. Your roof and local conditions may differ from the assumptions behind a broad estimate.
For an installation decision, ask for a forecast based on the actual property rather than relying on a national average.
Why daily output changes through the year
Solar panels work in winter, but shorter days, weaker sunlight and cloud cover reduce the electricity available compared with summer. Energy Saving Trust identifies these as the main reasons for lower winter generation.
The difference is easier to understand with a calculation. Consider two hypothetical days, using average panel output across the stated generating period:
| Illustrative day | Average output | Period | Generation |
|---|---|---|---|
| Shorter, lower-output day | 60W | 5 hours | 0.30kWh |
| Longer, higher-output day | 180W | 10 hours | 1.80kWh |
These are arithmetic examples, not typical winter and summer forecasts. They show why a panel can produce substantially different daily totals without its rated capacity changing.
They also explain why multiplying 400W by the number of daylight hours gives an unreliable estimate. Ten hours of daylight does not mean ten hours at the panel’s rated output.
National Energy Action’s generation examples show output rising and falling during the day, with cloud causing further fluctuations. A clear day and a changeable day can produce very different generation profiles.
Do solar panels still generate electricity on cloudy days?
Yes. Solar panels can use diffuse sunlight as well as direct sunshine.
The European Commission’s Joint Research Centre explains that some solar radiation reaches the ground after being scattered by the atmosphere. This diffuse component remains available when clouds block the direct sun. However, cloud cover also reduces the solar energy reaching the surface.
There is no single reliable percentage that describes output on every cloudy day. Thin cloud, heavy overcast conditions and passing clouds are different situations.
For a homeowner, the useful question is therefore how local weather affects generation over months and years. One grey afternoon provides very little information about the long-term performance of a proposed installation.
How roof direction affects solar panel output
An unshaded, south-facing roof is generally favourable for annual solar generation in the UK. East- and west-facing roofs can also work well. Energy Saving Trust says these orientations tend to generate around 15–20% less energy than a directly south-facing system.
For illustration, suppose a particular south-facing installation were forecast to generate 380kWh annually per 400W panel. Applying that general reduction would give:
- 15% less: approximately 323kWh per year.
- 20% less: approximately 304kWh per year.
This is a worked comparison, not a substitute for modelling the actual roof.
Direction also influences when generation occurs. East-facing panels tend to produce more during the morning, while west-facing panels favour the afternoon. South-facing systems tend to peak nearer midday.
That timing is worth discussing alongside the annual total. An installation assessment should consider when your household uses electricity as well as how much the panels could generate.
How much difference does shading make?
Trees, chimneys and neighbouring buildings can reduce the sunlight reaching a panel. Energy Saving Trust identifies all three as potential causes of lower system performance.
A useful shading assessment should answer specific questions: which panels are affected, at what times, and for how much of the year?
Avoid treating shade as a universal percentage deduction. A brief shadow and an obstruction affecting much of the generating day are different situations. System design also matters. Energy Saving Trust explains that some solar installations use optimisers to help minimise the impact of shading. Their suitability should be assessed for the roof concerned.
For a simple numerical illustration, if a forecast explicitly assumed a 10% shading-related reduction from an otherwise estimated 360kWh annual output, the adjusted figure would be 324kWh. The calculation is easy; establishing whether 10% is appropriate requires assessment.
Does hotter weather increase output?
Not necessarily. Strong sunlight helps generation, but higher solar cell temperatures generally reduce conversion efficiency. Solar Energy UK explains that panels convert a slightly lower proportion of sunlight into electricity in hotter conditions. However, longer days and more sunlight mean overall UK solar generation is still higher in summer.
This means a bright, cool day can provide favourable operating conditions. A hot summer day may still produce plenty of electricity, but heat itself is not what improves production.
The 25°C used in standard testing refers to the cells or module, rather than simply the outdoor air temperature. A forecast should account for operating conditions instead of assuming the nameplate rating applies whenever the sun appears.
How much electricity reaches your home?
The panel rating describes its DC electrical output. In a typical domestic installation, an inverter converts that electricity into AC for household use.
Generation estimates should account for system losses. PVGIS, the European Commission’s solar performance tool, includes allowances for losses such as those associated with inverters and cabling. Its modelling also considers the installation’s location and configuration.
When comparing estimates, check whether the quoted kWh figure represents panel-side generation or estimated usable system output. Do not automatically subtract another loss allowance from a forecast that already includes it.
What can a 400W solar panel power?
An energy total can help you understand scale, provided you distinguish it from power available at a particular moment.
For example, 1kWh is mathematically equivalent to:
| Hypothetical constant load | Operating time using 1kWh |
|---|---|
| 10W | 100 hours |
| 50W | 20 hours |
| 100W | 10 hours |
| 1,000W | 1 hour |
These are energy comparisons, ignoring any additional storage or conversion losses. They are not promises that one panel can directly run each load.
A panel generating 200W cannot independently supply a 1,000W appliance at that moment. In a grid-connected home without battery support, the remaining demand would come from the grid. National Energy Action explains this relationship between solar production, household demand and imported electricity.
Similarly, electricity generated at lunchtime cannot be kept for evening use by the panel itself. Storage requires a battery.
How does one panel relate to a complete system?
Panel wattage becomes more useful when considered alongside the number of panels:
| Number of 400W panels | Combined rated capacity |
|---|---|
| 1 | 0.4kWp |
| 6 | 2.4kWp |
| 10 | 4.0kWp |
| 12 | 4.8kWp |
The “p” in kWp indicates peak rated capacity.
As a purely illustrative calculation, ten panels each contributing 360kWh annually would together contribute 3,600kWh. An actual design needs a whole-system forecast, particularly where panels face different directions or experience different shading.
Annual generation also does not establish how much electricity you will use directly. The timing of production and demand matters, as does any battery storage.
For help choosing an appropriate installation size, read How Many Solar Panels Do You Need to Power Your Home?
Frequently asked questions
Does a 400W panel produce 400W all day?
No. The rating describes performance under standard test conditions. Actual power changes with sunlight and operating conditions.
Is 1kWh per day a reasonable estimate?
It is a useful rough annual-average reference within the benchmark discussed above. It should not be treated as a daily minimum or a property-specific forecast.
Can I calculate output using daylight hours?
Not accurately by multiplying daylight hours by 400W. You would need the average actual power across those hours, or a solar generation model that accounts for changing conditions.
Will an east-facing panel generate less than a south-facing one?
It will generally generate less annually under otherwise comparable UK conditions, but its morning generation pattern may still suit the property.
Does a battery make the panel generate more electricity?
A battery’s main purpose is to store electricity for later use. It does not increase the panel’s rated capacity.
How can I get a more accurate estimate?
Ask your installer for annual and monthly generation forecasts, with the roof direction, pitch, shading and losses clearly stated. PVGIS can also provide a location-based estimate, although nearby obstructions still need appropriate assessment.